You don’t know why you are collecting all of this data yet, but there is a tidal wave of information being compiled and collected for when a question is asked that necessitates some of that data for finding the answer. You collect engine data to monitor temperature and pressure to watch for unfavorable performance indicators. You know why you are taking the information off of the machine and how you will apply that information to monitor, analyze and diagnose the performance of the engine system.
When you grab every data point a machine can feed you—like how often an operator pushes a specific button, something so seemingly benign—you have not yet formulated the question to which the information will lend an answer.
Big Data appears to be a sort of proactive approach to future decisions and deeper analysis of specific trends. It is counter intuitive, in a sense. Big Data does not support Big Picture ideas, but rather seems to correlate better to highlighting the minute differences between very specific conditions to optimize the circumstances of unique environments.
But, then again, this may just be a scratch on the surface of a whole new world of understanding and information that is yet to be harnessed.
What it means to agriculture
In February of 2013, scientific leaders from the Agricultural Research Service (ARS) held a workshop to identify its changing needs of scientific information management as the amount of high quality data had increased drastically and was being collected at a faster rate. In its workshop summary, Big Data and Computing, ARS stated,
“Scientists are now generating vast amounts of high-quality data rapidly and relatively inexpensively. This fundamental change in the nature of science is presenting new challenges and demanding new approaches to maximize the value extracted from these large and complex datasets. This dramatic growth in data volume, variety and velocity has come to be known as Big Data.”
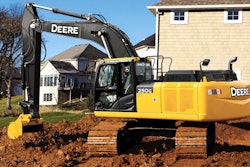
John Deere collects approximately 5 billion records per month off of its machines and stores it for Big Data purposes, according to Jim Lenz, John Deere Enterprise Sensors at the John Deere Technology Innovation Center.
“I think we can define Big Data by realizing it is something different from the typical engineering and marketing data we are used to working with for diagnostic purposes or product development modifications. We may not be able to define exactly what Big Data is yet, but we can define what it’s not,” says Lenz.
The concept of Big Data was started in universities and initially applied by internet giants such as Google and Amazon to show users additional information of value, such as suggesting related products using behavioral data. Once other non-internet companies started to see the possibilities with grabbing additional data, the idea of Big Data spread, but the hopeful potential of all of this information has yet to be understood. The why is still yet to be figured out as companies open the flood gates on billions of pieces of information.
“Big Data grabs every piece of information it can through the CAN bus, information you don’t even know if you need yet, or how you will use it. John Deere alone has over 100,000 messages per second coming off our CAN bus,” says Lenz. John Deere pulls data off of every machine equipped with a telematics system every 30 minutes and creates a single data record for each 30 minute block.
Lenz has found that the Big Data chunks of information John Deere is collecting and storing are not useful for diagnostics. “We still need engineering data from the machine for that purpose. Somewhere, someone was hoping that this Big Data idea would be able to answer all of our questions, but in reality I’m searching for a question that Big Data can answer for us.”
“The big difference between engineering data, for example, and Big Data, as we see it, is that Big Data has a difficult time capturing a piece of information’s context,” Lenz says. “Was the machine in idle or being driven down a road? Was the wind blowing and clogging the air intake more than usual causing the machine to run hotter than normal? All of these contextual factors are lost in the sea of data, and it is really important when analyzing data to make sure you are using correlating data gathered within the same context.
One benefit that has been realized by implementing the foundation for data collection through a machine’s telematics system is a faster and more accurate view into quality issues of a vehicle’s performance and manufacturing. “The information is coming back to the manufacturer almost right away, no more waiting for a customer to raise a feature fault to the dealer, and waiting for the dealer to bring any recurring faults to the manufacturer’s attention. We can track and see when certain messages are showing up that are related to system faults,” says Lenz.
“To be clear, Big Data still can’t isolate and diagnose and individual fault like typical engineering data can. The 5 billion records of data is an enormous amount of information, so the three or four specific messages I would normally use to understand a particular fault code is now lost somewhere in thousands of other data points averaged over 30 minutes. But, Big Data has allowed our engineers to see trends in machine faults and has helped them to see possible correlations. For example, a switch in a system provider or a recent design modification to a component that is having repeated issues can now be seen and evaluated more closely, faster.”
The issue of complexity
The ARS conducts research on natural resources and sustainable agricultural systems at multiple locations characterized by variable agro-climatic conditions. The high variability of agricultural systems presents both challenges and opportunities. With Big Data, analysis can be conducted across several locations and years to better understand and unify the complex interactions between crop types, soil types, water, weather, climate and management that produce differing results.
If methods are created that enable the precise and valuable analysis of Big Data, it could also be used to improve breeding programs with genetic condition variability which produce different agronomic traits. Traditional attempts to identify genes in an agronomic context have had to limit analysis to loci that produce large effects across several environments; but, many important traits are driven by multiple genes with small effects. The complexity of the analysis required to extrapolate the useful information out of the ‘small effects’ data pool, along with a smaller subset of environments to which the results would apply create an unappealing amount of work for smaller return.
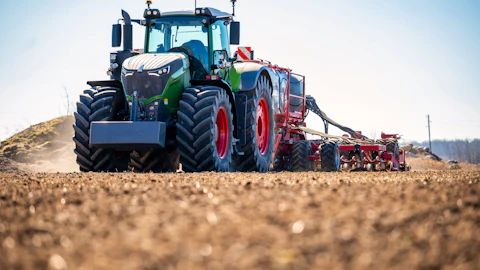
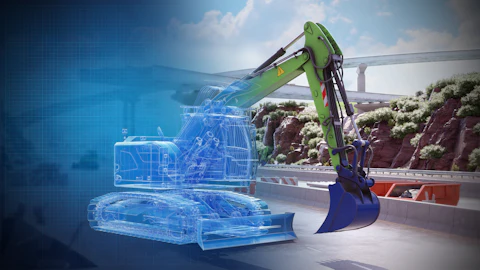
It is the significant volume and complexity of the data collected that makes Big Data so difficult to use effectively. Machine performance metrics and GPS location is already being layered together to create automated steering systems for navigating a field. A combine can have over 100 sensors on it to gather information that can be used to modify the machine’s performance, such as agronomic information like soil moisture or IR sensors to measure the health of a plant to adjust the specific amount of fertilizer or pesticide to spray on a particular section of field.
“At that point, when you are using data in real time to change a machine’s behavior or output, you weren’t collecting it, you were just using it and losing it after the machine change was implemented. Now, people want to collect all of it,” says Lenz.
“There are a lot of people in our industry, because the process of growing plants has so many variables to consider, that have been attempting to create a model of the process of growing plants. For example, oil refining has a model that shows you, for whatever quality of crude oil, how to refine it to make gasoline, lubricating oils, greases, fuel oils, diesel, etc.,” explains Lenz. “Growing a plant still has a lot of interactions that are difficult to model, and many people believe that Big Data will provide enough information to build an effective model.
“My farm alone has 350 different soil types, and between that variability and the differences in temperament of individual crops and the unpredictability of weather patterns, a single John Deere combine that is able to harvest over 30 different crops would need a crop model for every single crop and soil type combination the machine may encounter. That’s a lot of models.”
Companies like IBM Research are working with OEMs to create those precision agriculture models and simulations to help farmers make proactive decisions. These decisions are based on predictive information extrapolated from situational data collected through sensors in the fields to measure temperature, humidity and soil conditions, as well as field pictures taken from satellites and drones. Coupled with 48 hour weather information, a farmer can comfortably make predictions on future actions.
What it means in construction and mining
For a corporation as large as Caterpillar Inc. (company information, XXXXXXXX), “if you asked us to define what Big Data is, you would probably get a lot of different definitions,” says John Thomas, Marketing & Strategy Manager for the Construction Technology & Solutions group at Caterpillar. “If you talked to our group focused on sales, Big Data would have a lot to do with customer relationship management and answering questions like, who is your customer; what are they doing; and, what machines do they have?
“It would certainly touch on some information we get from telematics as far as how the customer is using each machine and for how many hours.” For the people trying to drive parts and service sales at Caterpillar, information on the number of hours a machine is being operated, for example, is important in order to see when the next preventative maintenance appointment should be scheduled and if the machine is producing any fault codes that may lead to part repair or replacement needs.
The product development group, would describe Big Data as a tool to better understand how the machines are being applied and used in the field for consideration in the next generation of vehicle design. “Which of the dozens of features we can build into our machines are being utilized the most by our customers? In some cases, it answers questions such as, Are we overbuilding a particular machine? Is the way that these different machines are being used similar enough that perhaps our differing vehicle structures don’t have to be as significant to reduce manufacturing complexity? That doesn’t happen very often, but that is a question that is asked and evaluated by looking at that data,” Thomas says.
What Caterpillar and other manufacturers are working towards is building capabilities into its equipment that base a system’s performance parameters on the current application being performed by a machine. And, while it is not an exact science, things can be determined with some certainty; for example, if a dozer is moving forward in first or second gear and the ripper is down, it is highly likely the machine is ripping.
“In some cases, this information will be very generalized and perhaps not as specific as some customers may like. A customer may say, ‘Part of the work we do is fine grading, and we want to make sure we can track that.’ If our definition of the application or task is broad and it covers all of grading from rough to fine, it may be hard for us to separate that out for the customer. But, it still gives us, from a product development standpoint, an understanding of how the machine is being used in the field,” says Thomas. This information can also give the customer an idea of machine usage for future job estimations based on more accurate task data like how much time was spent grading versus earth moving.
But one of the most forward thinking ways Cat is utilizing the idea of Big Data is with its demand planning team which analyzes information such as: how many machines are being built, which models specifically and for what regions of the world, and what does that mean for parts support and allocation for that specific part of the world?
“Being able to look at a combination of things including commodities and housing starts on top of our internal production numbers, we can start to see and identify trends that are indicators for us to increase or slow down production rates or shipping rates to specific parts of the world,” explains Thomas. “Some of that information we are just now working on integrating into our standard processes. It is certainly not something we are using to its fullest today. We are working on improving all of this information application with the use of big data.”
In some of the early analyses Caterpillar’s demand planning team has done show that for certain parts and machines, there is a definitive lag indicator. “If we see a decrease or a drop off in machine utilization, there can be a several-month lag between that machine usage drop-off and a decrease in sales numbers. So, the challenge for us is determining what that lag is so we can be as responsive as possible,” he says.
“When we think about using Big Data, typically we are focused on the data that is specifically coming from the machines combined with related information. For example, machine data coupled with Caterpillar’s SOS (scheduled oil sampling) provides information from samples of the various fluids collected by the dealer to help determine the health of the machine. Higher than normal levels of certain metals in a fluid can indicate a particular pump is failing or that a certain component is wearing abnormally.
“There are a lot of pre- and post-shift inspections and weather information, all of which can be combined with general machine data to give us a better idea of how the equipment is performing. Caterpillar offers condition monitoring that includes five key inputs – SOS; data off of our machines via ProductLink; site information (weather, temperature, altitude); service history; and inspection reports. You can tie customer information on top of that for even more unique analysis.”
Big Data doesn’t necessarily mean only big picture extrapolations or overarching trends, but also helps to take a closer look at specific instances. Just as the agricultural industry can use Big Data to create specific models for each crop and soil combination on the planet to integrate into its combine for optimized crop care, a construction equipment manufacturer can evaluate the globe with a microscope, finding regional differences and similarities that can help it to fine tune how it delivers to each market effectively.
“It helps us get a better understanding of the differences between different regions of the world, beyond demand planning. Are the machines being used differently? Are the customers different? Is the utilization different? Is the approach to how they do their work different? It helps us understand the world better,” confirms Thomas.
“We are cautious, however. A lot of customization and configurations bring forth a lot of manufacturing and logistics challenges. We’re not expecting that this data analysis practice will uncover a lot of significant differences that would drastically impact our manufacturing capabilities. We are actually hoping that it uncovers more commonalities to reduce the high number of existing customizations already out there.”
Benefits beyond the OEM
From a customer standpoint, the value that can be generated is a broad spectrum, and ultimately depends on the amount of engagement and utilization of the data that the customer is prepared to do.
The return on investment of using Big Data demends a lot of the willingness of the customer to invest time in frequent analysis and also to change processes based on that information. “The amount of value a customer gets who only looks at operation hours to determine maintenance needs is going to get significantly less ROI than someone who is looking at data actively to determine operation and idle times to try and maximize their fleet utilization,” Thomas says.
“The key thing that we’ve noticed with customers is they have to be ready to change their processes in order to capture a lot of this value. The more they react to Big Data, the more value it can deliver to them.”
But even Caterpillar is not ready to fully capitalize on Big Data. First and foremost, it wants to get more of its machines in the field connected to collect even more data. Right now Cat has over 250,000 connected units across the globe, and while that may be a good population, more is better, especially if there are certain regions with particularly low connectivity.
Start small with Big Data
For many customers, including Caterpillar’s, Big Data is a scary term. It encompasses a lot, much of which isn’t very clearly defined or understood yet, even by data experts in the off-road industry.
Thomas says that though it may be called Big Data, there are great ways to start simply with smaller, more digestable pieces of valuable information that Caterpillar and its dealers can help to identify for the user. “You don’t have to dive into the deep end of the data pool to get results. We rarely encourage customers to try and do it all at once because they often get overwhelmed and lose faith that it can provide ROI,” says Thomas.
Caterpillar’s user interface, Vision Link, is an easy-to-use dashboard a customer can use for both Cat and non-Cat equipment in his fleet. The customer can choose the pieces of information that are most of interest to the job. VisionLink takes a small subset of the information collected from the Product Link hardware that Caterpillar believes will add the most value to its customers.
The start of something Big
The mining industry is extremely data driven already, according to Fabio Mielli, Mining, Offer Manager at Schneider Electric. “Mining vehicles are already delivering data continuously on things like the engine system, fuel usage, load, emissions, and location to name a few. At Schneider Electric, we consider Big Data to be the collection of large data sets that require analytics and processing to manage and deliver actionable insights.”
Some companies are already finding valuable ways to use the data to modify their decision making processes. “The main opportunity resides in what other insights can be extracted from this data–like predictive maintenance, performance and efficiency—and enhanced with contextual data like shifts, cost and weather. The proper use of Big Data can drive decisions, foresee scenarios or support strategic movements in the industry.”
When an OEM begins to think about Big Data and what it can provide to its customers, the starting point should be understanding the data that is already available, according to Mielli. The goal of Big Data is not to inundate the user with lots of useless information, but deliver insights that drive decisions. The final objective is to drive productivity decisions.
All Big Data management systems, have three major elements:
- Smart sensors or other devices that are able to collect the myriad of data from the vehicles
- A wireless or wired network infrastructure to transmit the data collected, and
- An IT infrastructure (namely data centers) and analytic software able to gather the data, understand it and display it in a way that makes sense contextually and is of value to the user.
Particular attention should be paid to the security and integrity of the data as it is being transmitted and shared among different systems. Both above and below ground applications have demanding infrastructure challenges. Underground vehicles have no constant network access, while above ground vehicles typically require a wide area of coverage; both vehicle types require ruggedized systems. Most importantly, so as not to overwhelm or overload a user, Big Data should maintain high data quality to provide users with information that is of value and can be used to drive decisions.
Mielli believes that the future opportunity for Big Data lies with data quality, not quantity. “Data quality will play a huge role in avoiding an overflow of information from too much or even inaccurate data. The next step is to cross-reference different sources of data to deliver insights and decision making that wouldn’t be immediately achieved without co-relating such information. Basically, put the data in context. When the results of cross-referencing are combined, the users are able to make better business decisions.”