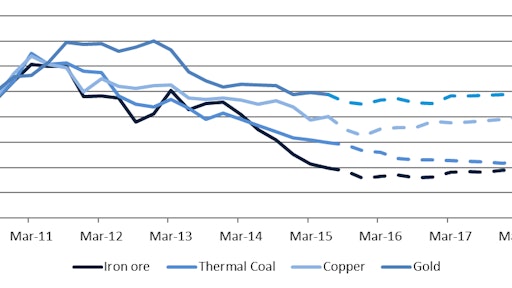
2015 proved to be another poor year for commodity prices. Prices fell across the year for all major commodities; however, now more than ever it appears to be the bottom of the trough. That said, 2016 has proved to be a stabilizing period, with many commodities halting the downward trend in prices: many unprofitable operations are closing and taking surplus production away from the global supply and demand balance.
Post 2016, there will be moderate growth in prices for copper and iron ore up to 2020. Lower prices, will in the medium term help adjust structural oversupply in these markets, leading to long term balance in global supply and demand, as demand recovers.
Timetric’s medium term outlook for key commodities:
Copper
In 2016 copper should trade at around US$5,300/t. Demand will start to match supply as a string of production cuts start to filter through the supply chain.
Global copper metal consumption is projected to grow at a CAGR of 2% from up to 2020 to reach 24.7Mt, with China accounting for more than half of the global consumption.
Growth in China is mainly due to the expansion of electricity networks, as well as its rapidly increasing urbanization. In addition, the country is encouraging its industrial sector to produce advanced products such as cars and consumer electronics, which will further drive the country’s copper demand.
In 2016, and then for the rest of the forecast period - due to substantial production growth expected from Peru, Zambia and the DRC - global copper mine production is projected to grow at a CAGR of 3.9%, to reach 23.8Mt in 2020.
Iron Ore
Iron ore prices should trade below US$50/t throughout 2016, as severe over capacity afflicts the industry and is made worse by reduced steel production in China. Expect the big three, Vale, Rio Tinto and BHP Billiton to increase their share of global supply, at the expense of smaller players.
Global iron ore consumption is projected to grow at a CAGR of 1.6% up to 2020, to a total of 1.8Bnt in 2020 mainly driven by demand from Asia – from the Indian and Chinese steel sectors supported by construction sector activities.
Continued ramp ups in previously committed investment in Australia and Brazil, by companies such as BHP Billiton, Rio Tinto and Vale together with new companies such as Roy Hill, will continue to drive production growth in the short term.
Gold
Up to 2019, global demand for gold is expected to increase at an average annual rate of 4%, reaching 5,119t. 2016 has been a significant year for gold. In the first quarter of the year, gold demand reached 1,290 tonnes in the March quarter, a 21% increase year-on-year, making it the second largest quarter on record. This increase was driven by huge inflows into exchange traded funds (ETFs), of 364t, fuelled by concerns around the shifting global economic and financial landscape.
Over the medium term the rise in demand for refined gold from Asian countries is mainly expected from its jewelry sector, with factors such as wealthy citizens, low gold prices and a supportive government playing major roles.
Global gold mine production is expected to grow, as low-cost operations will increase, as well as producing higher ore grades and increasing production rates, aimed at lowering the average production cost.
In Russia, gold production is projected to increase in the medium term in 2018, with the development of new upcoming mines, scheduled to be completed by 2017, including the Kinross Dvoinoye mine (7t); Polyus Gold’s Natalka mine (15t); and Norlisk Nickel’s Bystrinskoye mine (6t).
Similarly, Canada is expected to take over as the fourth-largest gold producer, as huge production is expected to commence from its gold mines – Detour Gold’s Detour Lakes mine, Goldcorp’s Elanore mine and Newgold’s Blackwater mine – by 2018. However, long-term growth is expected to enhance gradually, as exploration and programs on low-cost expansion are likely to be in focus for attaining low operating costs and improving return on investment.
Hot commodities – Niobium & Lithium
With depressed prices still a prevailing theme for most major mined commodities, more niche commodities are offering better value. One such commodity is Niobium. Niobium is used to produce stronger, lighter steel for industrial pipes and aircraft parts. It is mined in only a few places on Earth, and its price is roughly eight times higher than that of copper.
It recently came to global attention when China Molybdenum Co. outmanoeuvred at least 15 companies in March to purchase Anglo American Plc’s niobium and phosphate unit in Brazil, for US$1.5 billion. Crucially, current prices for Niobium are robust, at US$40,000/t, in comparison to those of copper which averaged US$5,510/t in 2015 on the LME and fell further in 2016 to average US$4,600/t in May.
The long-term outlook for Niobium is positive: 90% of its demand is from steel products, and while steel globally is struggling, the accepted wisdom is that steel consumption is moving towards higher grade products, rather than long rebar products. These high grade steel products are essentially alloys, used in specialist applications such as industrial pipes and transport industry parts. Indeed, the few remaining profitable steel companies, such as Voestapline, have moved to producing only “high quality and high tech steel products” according to Voestaplines CEO, Wolfgang Eder.
For Lithium there is strong price growth due to expectations of soaring demand from electric vehicles and market distortions in China. The current global demand is of 200ktpa. In 2016 lithium prices are up 47%. Prices are increasing due to increasing demand driven by battery production. Lithium is now called ”white petroleum” by some market analysts due to the large role it will play in powering electric cars produced by companies such as Tesla.
With electric car production to increase substantially; for example to date Tesla has produced 50,000 electric cars but by 2020 expects to production 500,000 annually, the demand for Lithium could triple to 600ktpa by 2020. By way of comparison, one Tesla car battery contains more lithium than 10,000 smartphones. Hence as Tesla and other car manufacturers ramp up EV production, the demand for Lithium will grow substantially.
Country of opportunities: Myanmar
Myanmar, although widely expected to contain world-class mineral resources, currently produces only relatively miniscule amounts of a variety of mineral commodities – its main commodity exports are rubies, sapphires, pearls and jade. Whilst it has modest-sized assets producing copper, nickel, lead, zinc, coal and gold, its production is comparatively tiny and underdeveloped as a result of decades of isolationist policies.
However, this looks set to change: following a constitutional referendum in 2008, and general elections in 2010, a nominally civilian government was introduced in 2011, embarking on reforms and on 8 November there were the first free general elections in 25 years.
Currently mining and mineral processing industries are mainly government-owned but the Myanmar Foreign Investment Law of 2012 seeks to encourage participation of foreign investors to help develop the country’s mineral industry. Mining reforms had stalled since 2012, but with the recent return to democracy it is expected reforms will continue and the country will be further opened to foreign investment. New laws to clarify rules and ease restrictions for foreign investors remain frozen in legislature, continuing to be debated.
Many producers and suppliers are eagerly exploring Myanmar in the hope it can provided a lift to the industry.
Equipment Needs – Look at available capex
Despite some positive signs, capital budgets remain weak. In the wake of global oversupply mining companies have, and continue to, cut back expenditure on any assets viewed as non-core.
For example, the top 20 mining companies by market capitalisation decreased capital expenditure by 24% on average in 2015. This was led by two of the largest global producers, Rio Tinto and Glencore, which decreased capital expenditures by 43% and 39% respectively in 2015.
Based on companies’ capital budget forecasts, it is likely that 2016 will see a 32% decrease in expenditure for the top 20, to US$43.15 billion, followed by a smaller fall in 2017 of 7% to US$40 billion. We have now moved to an era where companies’ capital expenditure budgets are predominately sustaining capex, rather than for expansions or new projects.
A lack of capital budgets, has meant that producers are being particularly picky in what they invest in, and need to see real returns in order to substantiate their investment. One such area is automation, where operating costs can be reduced and safety records improved.
Technology Investment: Automation
Automation in equipment exists in many forms. At its most basic form, automation has four levels that exist in mining operations:
- Fully automated systems, eliminating the need for human operators.
- Semi-autonomous systems, allowing only portions of the work cycle to be automated. The rest are controlled by operators from a central location.
- Autopilot systems, requiring operators to remain on the equipment or vehicle, but taking over when certain tasks are performed.
- Remote-control systems, which are still operator-dependent. These systems require line of sight, although the operator is not required to be on board. To eliminate the need for an operator to be right up at a drilling face or an underground stope, many drills that are used in underground activities use remote-control systems.
Underground mines already use automated equipment such as crushers, conveyors, transfers and hoists. These can fall under either semi-autonomous or fully automated systems. These pieces of equipment do not require operators to be around during the work cycle, and can be operated and monitored from a central location, such as an office on the surface. The migration towards autonomy is fueled by many factors, both site- and company-specific. Two of the most influential factors are the capital expenditure required to upgrade and replace machinery and equipment on site, and the financial benefit of the replacement of manual labor with machines. The benefits from improving an operation’s efficiency could prove to be enough for a mine to adopt this technology.
Surface Truck Automation
Currently, the three main iron producers in Australia are operating autonomous trucks, but Rio Tinto is the leader in the field. Rio Tinto was the first to implement the technology. In 2008, they started trialing driverless Komatsu trucks. Rio Tinto now has two of its operations running entirely autonomous trucks: Yandicoogina and Nammuldi. We can see in the global iron ore cost curve, that these two operations are some of the cheapest operations to run globally (both highlighted in red). This gives these operations incredible operating margins, and has meant Rio Tinto continued to make profits amid falling iron ore prices.
Other operators are following suit. Fortescue Metals Group (FMG) started using Caterpillar driverless trucks in 2011. As at June 2014, FMG has 12 driverless trucks at its Solomon mine. Finally, BHP Billiton followed suit and now has six driverless trucks at its Jimblebar mine, which has been in operation since late 2013.
BHP Billiton announced that in mid-2014 the trial will be expanded via a second circuit at Jimblebar and an increase to the fleet, with six new trucks operating in the pits at neighboring site, Wheelarra.
In 2013, the first use of driverless trucks in the Australian coal industry occurred. The Meandu coal mine, run by Stanwell Corporation, started a three-year trial of three autonomous trucks in conjunction with Hitachi Construction Machinery (Australia). Should the trial be considered successful, Stanwell intends to roll out more autonomous trucks in 2015.