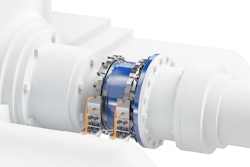
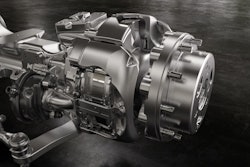
Allison Transmission Holdings Inc, the largest global provider of commercial duty fully-automatic transmissions, reports net sales for the first quarter of $675 million, a 2% increase from the same period in 2018. The increase in net sales was principally driven by higher demand in the North America On-Highway and Outside North America Off-Highway end markets partially offset by lower demand in the Service Parts, Support Equipment & Other and North America Off-Highway end markets.
Net Income for the quarter was $167 million compared to $151 million for the same period in 2018. Adjusted EBITDA, a non-GAAP financial measure, for the quarter was $290 million compared to $275 million for the same period in 2018. Net Cash Provided by Operating Activities for the quarter was $194 million compared to $153 million for the same period in 2018. Adjusted Free Cash Flow, a non-GAAP financial measure, for the quarter was $175 million compared to $143 million for the same period in 2018.
David S. Graziosi, President and Chief Executive Officer of Allison Transmission comments, “I am pleased to report that first quarter 2019 Net Sales increased 2% from the same period in 2018. Furthermore, year-over-year Net Sales growth was surpassed by even stronger growth in Net Income, up 11%, Diluted EPS, up 22% and Adjusted EBITDA, up 5%. During the first quarter, we achieved Net Income and Adjusted EBITDA as a percent of Net Sales of 25 and 43%, respectively.” Graziosi continues, “Allison also maintained its well-defined approach to capital structure and allocation. During the quarter, we settled $50 million of share repurchases, paid a dividend of $0.15 per share, and refinanced our long-term debt, demonstrating once again, our commitment to prudent balance sheet management through a low-cost, flexible and pre-payable debt structure with long-dated maturities, while simultaneously investing in our business and returning capital to shareholders.”
First Quarter Highlights
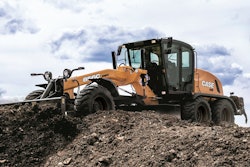
North America On-Highway end market net sales were up 11% from the same period in 2018 and up 24% on a sequential basis, in both cases principally driven by higher demand for Rugged Duty Series and Highway Series models.
North America Off-Highway end market net sales were down $19 million from the same period in 2018 and down $3 million sequentially, in both cases principally driven by lower demand from hydraulic fracturing applications.
Defense end market net sales were down 14% from the same period in 2018 and down 11% on a sequential basis, in both cases principally driven by lower Tracked vehicle demand.
Outside North America On-Highway end market net sales were up 3% from the same period in 2018 principally driven by higher demand in Europe and down 1% sequentially.
Outside North America Off-Highway end market net sales were up $15 million from the same period in 2018 principally driven by higher demand in the energy sector and down $20 million on a sequential basis principally driven by lower demand in the energy, mining and construction sectors.
Service Parts, Support Equipment & Other end market net sales were down 13% from the same period in 2018 and down 12% sequentially, in both cases principally driven by lower demand for North America service parts.
Gross profit for the quarter was $359 million, an increase of 5% from $342 million for the same period in 2018. Gross margin for the quarter was 53.2%, an increase of 160 basis points from a gross margin of 51.6% for the same period in 2018. The increase in gross profit from the same period in 2018 was principally driven by a reduction in expenses related to the retirement incentive program for certain UAW Local 933 employees, increased net sales, price increases on certain products and lower incentive compensation expense.
Selling, general and administrative expenses for the quarter were $84 million, a decrease of $8 million from $92 million for the same period in 2018. The decrease was principally driven by 2018 product warranty adjustments and lower 2019 product warranty expense partially offset by increased commercial activities spending.
Engineering – research and development expenses for the quarter were $31 million, an increase of $3 million from $28 million for the same period in 2018. The increase was principally driven by increased product initiatives spending.
Interest expense for the quarter was $36 million, an increase of $6 million from $30 million for the same period in 2018. The increase was principally driven by expenses related to long-term debt refinancing.
Net income for the quarter was $167 million, an increase of $16 million from $151 million for the same period in 2018. The increase was principally driven by increased gross profit and lower selling, general and administrative expenses partially offset by increased interest expense and increased product initiatives spending.
Net cash provided by operating activities was $194 million, an increase of $41 from $153 million for the same period in 2018. The increase was principally driven by lower operating working capital requirements and increased gross profit partially offset by increased cash income taxes and increased cash interest expense.
First Quarter Non-GAAP Financial Measures
Adjusted EBITDA for the quarter was $290 million, an increase of $15 million from $275 million for the same period in 2018. The increase in Adjusted EBITDA was principally driven by increased gross profit and lower selling, general and administrative expenses partially offset by increased product initiatives spending.
Adjusted Free Cash Flow for the quarter was $175 million, an increase of $32 million from $143 million for the same period in 2018. The increase was principally driven by increased cash provided by operating activities partially offset by increased capital expenditures.
Full Year 2019 Guidance Update
Allison is affirming the full year 2019 guidance ranges released to the market on February 25 for Net Sales, Adjusted EBITDA, Net Cash Provided by Operating Activities, Adjusted Free Cash Flow and cash income taxes. Allison expects 2019 net sales to be in the range of $2,580 to $2,680 million, Net Income in the range of $525 to $575 million, Adjusted EBITDA in the range of $1,000 to $1,060 million, Net Cash Provided by Operating Activities in the range of $710 to $750 million, Adjusted Free Cash Flow in the range of $550 to $600 million and cash income taxes in the range of $100 to $110 million.
Its 2019 net sales guidance reflects lower demand in the North America Off-Highway and Service Parts, Support Equipment & Other end markets principally driven by lower demand from hydraulic fracturing applications partially offset by increased demand in the North America On-Highway end market, price increases on certain products and continued execution of our growth initiatives.