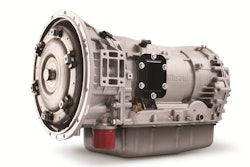
Allison Transmission Holdings Inc., the largest global provider of commercial duty fully-automatic transmissions, has reported net sales for the third quarter of $692 million, a 16% increase from the same period in 2017. The increase in net sales was principally driven by higher demand in the Global On-Highway, Outside North America Off-Highway and Service Parts, Support Equipment & Other end markets.
Net Income for the quarter was $167 million compared to $111 million for the same period in 2017. Adjusted EBITDA, a non-GAAP financial measure, for the quarter was $295 million compared to $241 million for the same period in 2017. Net Cash Provided by Operating Activities for the quarter was $239 million compared to $215 million for the same period in 2017. Adjusted Free Cash Flow, a non-GAAP financial measure, for the quarter was $216 million compared to $195 million for the same period in 2017.
David S. Graziosi, President and Chief Executive Officer of Allison Transmission comments, “I am pleased to report that third quarter 2018 net sales growth exceeded our expectations and the guidance ranges provided to the market on July 30, and 2018 is on track to be a record year.” Graziosi continues, “Year-over-year net sales growth of 16% was surpassed once again, by even stronger growth in Net Income, up 50%, Diluted EPS, up 69% and Adjusted EBITDA, up 22%. Also during the quarter, we continued to execute our well-defined approach to capital structure and allocation by settling $86 million of share repurchases and paying a dividend of $0.15 per share. Given third quarter 2018 results and current end markets conditions, we are raising our full year 2018 net sales guidance from an increase in the range of 15-18% to an increase in the range of 18-19%.”
Third Quarter Highlights
North America On-Highway end market net sales were up 10% from the same period in 2017 principally driven by higher demand for Rugged Duty Series models and down 3 % on a sequential basis principally driven by lower demand for Transit Series and Pupil Transport/Shuttle models.
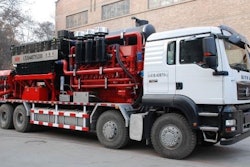
North America Off-Highway end market net sales were down $5 million from the same period in 2017 and down $19 million sequentially, in both cases principally driven by lower demand from hydraulic fracturing applications.
Defense end market net sales were up 20% from the same period in 2017 principally driven by higher Tracked and Wheeled demand and down 2% on a sequential basis.
Outside North America On-Highway end market net sales were up 8% from the same period in 2017 principally driven by higher demand in Asia and down 5% sequentially principally driven by lower demand in Europe.
Outside North America Off-Highway end market net sales were up $32 million from the same period in 2017 and up $22 million on a sequential basis, in both cases principally driven by improved demand in the energy, mining and construction sectors.
Service Parts, Support Equipment & Other end market net sales were up 18% from the same period in 2017 principally driven by higher demand for North America service parts and Global support equipment and down 3% sequentially principally driven by lower demand for North America Off-Highway service parts.
Gross profit for the quarter was $368 million, an increase of 22% from $302 million for the same period in 2017. Gross margin for the quarter was 53.2%, an increase of 240 basis points from a gross margin of 50.8% for the same period in 2017. The increase in gross profit from the same period in 2017 was principally driven by increased net sales, price increases on certain products and favorable material costs partially offset by higher manufacturing expenses commensurate with increased net sales.
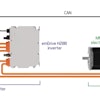
Selling, general and administrative expenses for the quarter were $89 million, an increase of $11 million from $78 million for the same period in 2017. The increase was principally driven by higher warranty expense commensurate with increased net sales, favorable dual power inverter module (DPIM) extended coverage and product warranty adjustments in 2017 that did not recur in 2018 and increased commercial activities spending.
Engineering – research and development expenses for the quarter were $33 million, an increase of $7 million from $26 million for the same period in 2017. The increase was principally driven by increased product initiatives spending.
Income tax expense for the quarter was $51 million, resulting in an effective tax rate of 23% compared to $59 million of income tax expense and an effective tax rate of 35% for the same period in 2017. The decrease in effective tax rate was principally driven by the U.S. Tax Cuts and Jobs Act enacted into law in December 2017.
Net income for the quarter was $167 million compared to $111 million for the same period in 2017. The increase was principally driven by increased gross profit and lower income tax expense partially offset by increased selling, general and administrative expenses and increased product initiatives spending.
Net cash provided by operating activities was $239 million compared to $215 million for the same period in 2017. The increase was principally driven by increased gross profit and decreased cash interest expense partially offset by higher operating working capital requirements, increased product initiatives spending, increased cash income taxes and increased commercial activities spending.
Third Quarter Non-GAAP Financial Measures
Adjusted EBITDA for the quarter was $295 million compared to $241 million for the same period in 2017, an increase of $54 million. The increase in Adjusted EBITDA was principally driven by increased net sales, price increases on certain products and favorable material costs partially offset by increased selling, general and administrative expenses, increased product initiatives spending, and increased manufacturing expenses commensurate with increased net sales.
Adjusted Free Cash Flow for the quarter was $216 million compared to $195 million for the same period in 2017, an increase of $21 million. The increase was principally driven by increased cash provided by operating activities partially offset by increased capital expenditures.
Full Year 2018 Guidance Update
Updated full year 2018 guidance includes a year-over-year net sales increase in the range of 18-19%, Net Income in the range of $600 to $620 million, Adjusted EBITDA in the range of $1,090 to $1,110 million, Net Cash Provided by Operating Activities in the range of $785 to $805 million, and Adjusted Free Cash Flow in the range of $685 to $715 million. Capital expenditures are expected to be in the range of $90 to $100 million and cash income taxes are expected to be in the range of $100 to $110 million.
Allison’s full year 2018 net sales guidance reflects increased demand in the Global On-Highway and Global Off-Highway products, price increases on certain products and continued execution of our growth initiatives.
Although it is not providing specific fourth quarter 2018 guidance, Allison does expect fourth quarter net sales to be up from the same period in 2017 and down sequentially.