Driving up to a peak can be a fun ride. Coming down from the mountain top might not be quite so exhilarating. But that is a capsule summary of what is ahead in North American heavy-duty truck markets as we transition from a near all-time industry high in 2019 to an “average” 2020. The perfect storm of positives that led to a 2019 top for sales and production are fading, and the headwinds are building.
The economic setting at the close of 2019 is not as prosperous as it was at the end of 2018. It is true that the current economic expansion is in record-setting territory for length. In July it broke the previous 10-year record, and is reaching out to 124 months as of October, and should carry through the fourth quarter and beyond into 2020.
But while the length is extended, the vigor is fading. GDP metrics fell from 3% growth in 2018 to a 2% pace in 2019 year-to-date statistics. U.S. manufacturing sector output has declined from December 2018 to July, according to Federal Reserve statistics—after recording the strongest year of the expansion in 2018.
The reasons for this loss of momentum are easy to identify. The boost from the Tax Cuts and Jobs Act (passed in December 2017) was real, but 20 months later its impact is fading. The global economy is slowing. The stock market has been volatile. The election season of 2020 is already underway, and the campaigning has a negative undertone. And most important of all, the Administration’s trade and tariff policies have added to caution and uncertainty for many businesses, especially those impacted by imports or exports to China, either directly or on second-order effects.
While consumer and business confidence is still stronger than it was 3 years ago – autumn 2016 marked the start of a boom period for capital equipment, heavy machinery and for heavy truck markets – the confidence data also show we have stepped down from levels reached in early 2019. That sets a more somber tone for equipment purchases in 2020.
It is important to note one factor in the market that has stayed on the sidelines in the last few quarters, energy prices. Severe escalation of energy prices in 2008 was a contributor to the 2008-2009 recession and the heavy truck industry collapse. Even lower energy prices (given volatility) were a disruptive force in 2015, when the downward spiral of crude prices by 65% over six quarters (2014:Q4 to 2016:Q1) made truck demand in the oil patch evaporate. In contrast, steady crude prices in the $50-65/bbl range (WTI) and diesel prices stable near $3/gal. nationwide should be a positive factor, figuring they will be sustained into 2020.
One stumbling block faced by the truck market in the months ahead is the challenge of higher interest rates and the “flat yield curve.” Starting in 2015 and running to December 2018, the Federal Reserve Board hiked rates nine separate times, by a total of 2.25%. Higher policy rates mean higher borrowing costs for businesses. Granted, the Fed has (and perhaps will) reduce rates, but those actions impact the economy with a lag. [Editor's note: The Federal Reserve announced on Sept. 18 its second interest rate cut of the year, which you can read more about at oemoffhighway.com/21087542.]
This push by the Fed contributed to a “flat yield curve,” which means that there are uniform borrowing rates for short-, medium- and long-term U.S. Treasury borrowing. Analysts have identified the flat yield curve as a lead indicator for recessions, and this has added to stock market variability and business uncertainty in 2019.
When looking at metrics that are specific to heavy trucks, there are three key primary markets—over-the-road truck freight activity (for Class 8 tractors, day cabs and Class 5-7 trucks), non-residential construction (for Class 8 day cabs and straight trucks, and Class 5-7 trucks) and residential construction (for Class 8 straight trucks and Class 5-7 trucks).
All three high level metrics show strong growth in 2018, a transition year in 2019, and a slow year in 2020. For over-the-road freight, ACT Research’s proprietary freight index grew at 5.7% in 2018, should decelerate to +2% in 2019 and is forecast to be flat (zero year-over-year growth) in 2020. Non-residential construction (public and private) grew 3.7% in 2018, is forecasted to slow to 2% in 2019 and be slightly down in 2020. Residential construction dropped by 1.5% in 2018, and is forecast to decease by about 3% in both 2019 and 2020.
Looking at those kinds of rates of change, one might expect fairly modest responses on the part of truck buyers. But that was not the case for Class 8 in 2018 and 2019. New tax incentives for asset purchases, a driver shortage, regulatory restrictions on driver hours, extended backlogs that pushed delivery dates far beyond buyer “comfort zones” combined with favorable market conditions all ignited a buyer frenzy in 2018. Together they pushed all Class 8 market segments to high volumes. Tractor sleeper sales were the strongest, growing 40% to an all-time record at over 143,000. Daycabs were at 89,000 (up 23%), and straight trucks had the best sales year in over a decade, though with a more modest 8% gain to nearly 83,000 units in North America. Class 5-7 trucks were slightly short of retail sales’ high water marks, though total retail sales did reach a robust 200,000 units.
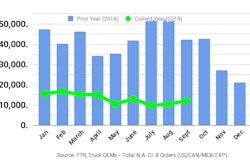
While the sales momentum carried forward into 2019, signs of a fraying market in response to economic pressures and a potential overshoot started to appear. Class 8 truck net orders, which averaged over 40,000 per month in 2018, collapsed to 14,000 per month from January to June 2019. Class 5-7 orders did not face such a severe retreat, but did slip from 19,000 plus per month in 2018 to just over 16,000 this year.
While 2019 still has one more quarter to go, forward visibility is clear enough to be highly confident in our forecasts. 2020 is necessarily speculative, but the dimensions of the economic slowdown, the difficulty of excess capacity, and the thin backlogs (especially compared to last year) stand behind the market forecast presented in the following table:
| North America Retail Sales | 2019 | 2020 | % Change |
| Total Class 8 Retail Sales | 332.2 | 255.5 | 23 |
| Tractor Sleeper | 151.8 | 103.5 | 32 |
| Tractor Day Cab | 94.1 | 71.3 | 24 |
| Straight Truck | 86.3 | 80.7 | 6 |
| Class 5-7 Truck Retail Sales | 212.0 | 201.2 | 5 |
ACT Research believes this is a fair forecast for next year, and there are factors to monitor if the forecast stays on track.
The first is credit availability. Bank credit is key to the continuance of any business expansion. One of the reasons the yield curve commands attention is that a flat yield curve usually brings pressure on bank margins. When that happens, bank loan portfolios are scrutinized; marginal, high risk borrowers get turned away. Whether you keep a finger on the pulse by conversations with your banker, or by listening to anecdotes from suppliers or customers, we suggest keeping track of credit availability.
Closely linked to credit is used equipment prices. The purchase of a used truck or other similar equipment is usually bank financed. A fall-off in truck and equipment prices is a sign of both weakening market demand and bank credit drying up. It’s no surprise they usually move together.
 ACT Research
And of course, watch for signs of a possible recession – a major correction (20%) in the stock market, business confidence collapse, and a deep fall-off in auto and housing purchases usually send the signal before recession calls become “official.” Right now our assessment is that there will NOT be a recession, but we do think that it is a reasonable alternative scenario for which to plan.
In the world of policy and politics, if…and it’s a big if…a win-win trade deal between the U.S. and China became a reality in the next few months, that would lift a major business uncertainty. No question it would raise our forecast numbers, depending on timing and terms of the agreement.
In summary, 2020 markets for Class 8 vehicles and Class 5-7 will see a retreat, and a significant one for Class 8, especially Class 8 tractors, based on what we see now. But consider it a return to average levels, a regression-to-the-mean after a peak that was an overreach.